table of contents
Preface
On March 3, 24, the public land prices for 3 were announced.
It will be the first public land price after the epidemic of the new corona infection (how many times have I written this word? Should I register the word?).
Now let's see what's in it.
1.Overall overview
Land prices for one year from January XNUMX
Summary of XNUMX land price publication results
○The national average for all uses turned to decline for the first time in six years since XNUMX.By use, residential land prices fell for the first time in five years since XNUMX, commercial land prices for the first time in seven years since XNUMX, and industrial land prices increased for the fifth consecutive year, but the rate of increase slowed.
〇Although the overall market is weak due to the impact of the new coronavirus infection, the degree of change in land price trends varies depending on the use and region.The change from last year is that commercial land is larger than residential land by use, and the three major metropolitan areas are larger than rural areas by region.
When it comes to the whole thing, it can be summarized in the first sentence above.In addition, the impact of the contraction of economic activity due to the corona crisis on land prices can be summarized in this second sentence.The reason why the degree of change is greater in the commercial area than in the residential area is thought to be that the commercial area is more prosperous and the rate of change is higher due to the relatively high price. increase.
In addition, no sudden changes were seen in residential areas due to the nature that prices are formed according to the income levels of local residents.It is thought that it can be said that
2.Introduction of points showing characteristic movements
rising point
〇 Kutchan-3 (3 standard land price: 135,000 yen/m25.0, rate of change: +XNUMX%)
[March 3, 3] Land prices for 24 have been announced
〇 5-1 Kutchan (3 standard land price: 121,000 yen/m21.0, rate of change: +XNUMX%)
It is located near Kutchan Station in Kutchan Town, Hokkaido.In the villa area around Kutchan-cho, which has become a world-famous tourist destination as a Niseko resort brand, the overall number of transactions has decreased due to the corona crisis, such as development plans that look ahead to the end of the new coronavirus infection. Land prices continued to rise, despite a decline in the rate, and became the highest rise in residential areas in Japan.In the commercial area in front of the station, there is a sense of expectation that convenience will improve as a result of the extension of the Hokkaido Shinkansen.
Hokkaido's resort area is showing the rising point again this year.Niseko strong.
Kutchan-3 shows an increase rate of 25%, but since it showed an increase of 44.0% last year, it can be said that the increase has narrowed.
Another thing to mention is the price range.Both of the above two locations are in the 2 yen/m10 range, so the price range is relatively low, so there is a tendency for prices to rise.
drop point
〇 Osaka Chuo 5-2 (Reiwa 3rd year standard land price: 21,100,000 yen/m26.5 Change rate: -XNUMX%)
〇 Osaka Chuo 5-19 (Reiwa 3rd year standard land price: 5,800,000 yen/m28.0 Change rate: -XNUMX%)
It is located near Namba Station in Osaka City, Osaka Prefecture.Due to the corona crisis, the number of domestic and foreign tourists has decreased sharply, the profitability of product sales and restaurants has been greatly damaged, and land prices have turned downward. -5).
The one-two-top, which ranked first and second in the rate of decline nationwide, was the commercial area of Osaka.As far as this explanation is concerned, the land price has fallen due to the decrease in the number of domestic and foreign tourists.Looking at it, Osaka City tends to have high volatility (change rate), and the change rate of Osaka Chuo 1-2 in the previous year increased by 5%.The next year it fell by 2%, so it seems like the land price fluctuations have been like a roller coaster for the past two years.
In addition, Kutchan-3 and Kutchan 5-1 in Hokkaido, which show the largest increase in the previous section, are also resort areas and will rise due to expectations for development after the end of COVID-XNUMX.
In summary, the decline in land prices means a decrease in tourists, and the rise in land prices means expectations for development plans aimed at tourists.
Will this become a tourist country?
3.Tokyo area
Below is a map showing trends by municipality.
Rate of change in 2 public announcement of land prices
https://www.mlit.go.jp/totikensangyo/content/001391251.pdf
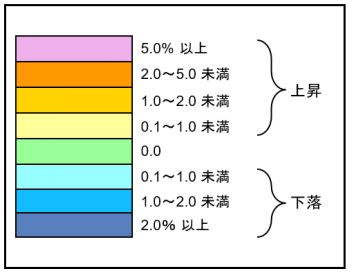
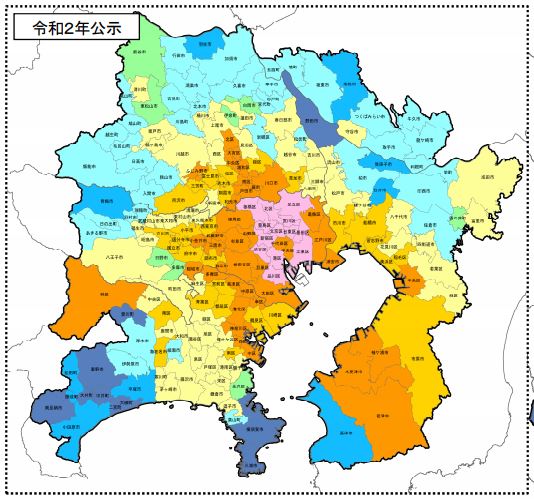
This is the rate of change in the published land price for 3. (Residential areas)
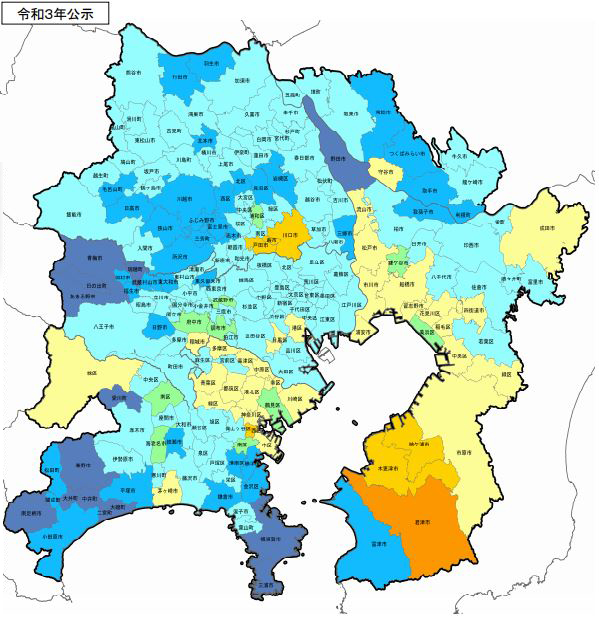
The wards of Tokyo are generally light blue (descending trend), but you can see the skin color.Minato-ku increased by 0.3%, and Meguro-ku also increased by 0.3%.I want to teach the Hills tribe too!
Looking at other areas, it is interesting to note that a dark beige corner in the southern part of Saitama Prefecture, which is adjacent to Kawaguchi City, Warabi City, and Toda City, is showing an increase of XNUMX-XNUMX%. hey.
It is thought that the advantage of access to the city center is favored even during the corona crisis.
In addition, the area from Uchibo in Chiba Prefecture to the south is showing an increase across the board.Is this due to the relatively low price range?
Afterword
In the midst of the corona wreck, I saw the 9 public land prices announced following the 2 prefectural land price survey announced in September last year.
The main reason for the rise in prices is the expectation of development of tourist areas in resort areas, and the decrease in the number of tourists is the reason for the biggest drop.This consideration may not be wrong, but I was also surprised that the price of land is greatly influenced by tourists.
<end>